Your shopping cart is currently empty!
For their successful, good life Information you really need: Government-funded publisher, awarded the Global Business Award as Publisher of the Year: Books, Magazine, eCourses, data-driven AI-Services. Print and online publications as well as the latest technology go hand in hand - with over 20 years of experience, partners like this Federal Ministry of Education, customers like Samsung, DELL, Telekom or universities. behind it Simone Janson, German Top 10 blogger, referenced in ARD, FAZ, ZEIT, WELT, Wikipedia.
Disclosure & copyrights: Image rights by Philip Kahler. Text originally from: “Trading strategies” (not only) for extreme situations. Use greed, fear and panic to your advantage” (2009), published by Münchener Verlagsgruppe (MVG), reprinted with the kind permission of the publisher.
Stock market and finance strategies for extreme situations: earn money despite uncertainty
By Philip Kahler (More) • Last updated on October 19.07.2023, XNUMX • First published on 04.12.2020/XNUMX/XNUMX • So far 7866 readers, 1802 social media shares Likes & Reviews (5 / 5) • Read & write comments
Anyone on the stock market even in extreme situations Money to earn must also understand the stock markets in theory and be aware of your insecurities. What is important?
Market theories
A quote has been handed down from Sir Isaac Newton in which he complains that he can now calculate the course of the stars and planets, but not the madness of the masses. He made that statement after almost his entire life Capital lost in the South Sea Bubble. A few centuries later, the Long Term Capital Management Fund (LTCM) met the same fate. Although guided by the statistical models of highly gifted mathematicians, including Nobel laureates Myron Scholes and Robert Merton, the fund ultimately lost all of its capital. The private and institutional investors believed in the risk-free 40% on the capital employed, in the end the central bank had to step in to save the financial system. In the summer of 2008, the mortgage crisis was far from over, and a number of banks and funds were once again on the brink of collapse.
Such events suggest that our understanding of the nature of price action is still very much in its infancy. And indeed, the first scientific work on the subject of the stock market only appeared in 1900: the "Théorie de la Spéculation" by the French mathematician Louis Bachelier. He explored the question of how courses develop - not in which direction they develop, but how a course development looks in general. This is a matter of principle Significance. For example, is holding a stock for two weeks instead of just one week twice as risky? How likely is it that the stock will move more than 10% down tomorrow? Which Risks do I die during the year if I risk 1000 euros in the market every day? To such Ask In order to be able to answer it, it is an advantage to have a theoretical model of the market. This model can be used to make predictions about possible future price developments and then to test these results against reality for their validity. Such predictions can be, for example, an estimate of volatility or sound position sizing approaches. But I have to disappoint you right at the start. Unfortunately, there is no such model on the market yet. Despite multiple attempts by the best minds, there is not even a roughly correct theory about the market. And yet there are some theories about the market-like systems, so using these theories one can at least paint a rough picture of what might happen tomorrow. Interestingly, many of these theories arose in the environment of fortune seekers and gamblers. It is only in the recent past that the subject of "methods of speculation" has also been included in the curricula at universities.
Random walk
The random walk is one of those theories that can be used to explain essential properties of the market. The scientists among you know the random walk as a special case of Brownian motion. But the molecular movement is not the issue here, but the price development. To illustrate this basis of course description, I would like to invite you to play a game. The game is a simple coin toss: Whenever »Head« appears, win one euro; appears »number«, verlieren you a euro. Note your account balance after each run and you'll get a random walk chart.
This curve now has some characteristics that you can also observe in the market. For example, consider the emerging trends. They look similar to the trends on the price chart, yet they just happened by accident. Just as long sequences of "all red" or "all black" can occur again and again in roulette, it is apparently not unlikely that heads or tails will appear several times in a row in this game. You will also see formations as seen on the stock market. Weren't there several double bottom formations on the chart? Do you see the head and shoulders formation? Doesn't every trend show minor corrections that could possibly be used for acquisitions? You see them Pattern, I see the patterns, and yet neither of us sees anything that can be used in any way for a successful trading strategy. The curve is – and the name already tells us this – a random walk. Whether the next pips go up or down depends solely on whether the next coin toss is heads or tails. Even if, as a human being, one immediately sees the patterns supposedly suitable for trading, they cannot be used for trading due to their random nature.
Although you can describe the random curve using the methods of charting techniques, you cannot derive any benefit from this description. And yet this curve has properties that you can also use on the market. Think about your money management. If you are not a very good but disciplined trader then your trading will look something like this curve. Sometimes you win, sometimes you lose. Good phases alternate with bad ones, but »in the long run« your portfolio oscillates around the zero line. Fortunately, as a trader you don't have to delve too deeply into the mathematics of chance. Above all, it is important for us to understand the implications of the theories. So many traps can be avoided. In the case of the random walk, this curve that has arisen by chance looks very similar to the stock market, but it is still only an illustration of chance. You can't make a curve like that successfully trade using the classic methods of technical analysis. Any trading approaches you would test with such a curve would result in a random walk again. Just because something looks like a stock market doesn't mean it's a stock market. However, since you cannot rule out that the stock market is controlled purely by chance, you must consider with your trading strategies whether they are also based on a property of the market that is not only controlled by chance. Unfortunately, just because you can see the patterns does not mean that they can also be used for a successful trading strategy.
The expected value
In connection with the random walk curve, I would also like to add another one that will be used more often later Term introduce: the expected value. It tells what score I will get on average if I play the game long enough. In this case, the result is clear: it is zero. No matter how skillfully you play this game, in the end you will have lost everything you have gained in the meantime. For this reason, this coin toss game is also known as a zero-sum game. One game that is almost a zero sum game is roulette. If zero didn't exist, it would be a zero-sum game. The zero - if it appears, the bank wins - gives this game one light negative expected value. On average, the bank wins 1/37 of the bets placed at the table per round.
The stock market is also a game with a slightly negative profit expectation. In theory, it is a zero-sum game. The money is just redistributed between the winners and losers, nothing is created or disappeared. In practice, however, you pay brokerage fees and the bid-ask spread for every transaction. This turns the stock market into a game with negative expected value for you. The higher the expenses to be paid and the higher the bid-ask spread, the more negative the expected value. Especially for private traders is the selection a very liquid market and a broker with minimal fees. With the conditions of most house banks, you would have to be a crafty professional to still come up with a positive expected value for many transactions after expenses.
Efficient Markets Theory
The theory of efficient markets is closely related to the random walk theory. It states that the current price always reflects all available information. This is fast written, but has major implications for how we aim to beat the market. The next course is always formed on the market where the majority of the capital willing to buy is just as convinced of its advantage as is the majority Seller of their are. However, if all the available information is reflected in the course, then no matter how you do it, you cannot carve out an advantage over the other market participants. This would mean the end of trading and a return to the buy and hold approach. Well, the markets aren't that efficient, but mostly they are clear more efficiently than we dealers would like. To understand market efficiency, we must first familiarize ourselves with the term Information deal with. Information can, for example, be a message that is not yet generally known. For example, if you are a well-informed trader and use your information network to learn something from the boardroom of an interesting corporation, you may come across inside information. Putting aside the fact that speculating with such information is not legally sound, let's focus on how your actions affect the market.
After learning that an AG takeover is imminent in the next few days, start buying today. By buying the stock now but there are no new reasons to buy the stock merchandise, drive up the price of the stock. You will do this until the share price is where you expect the takeover offer to be. Whether or not the trade will turn out to be a profit is another matter. What is important here is that you have established market efficiency yourself. Even if the information about the upcoming takeover offer is still not widely known, you have already driven the price so far that no further profit can be made from the information about the takeover. So all information, even if only one market participant has it, is included in the price of the share. However, information is not only hard economic facts such as dividends, orders and company profits, but also all information that can be derived from the past. This can be, for example, the information that you pull from an indicator or a price pattern.
The efficiency of the markets
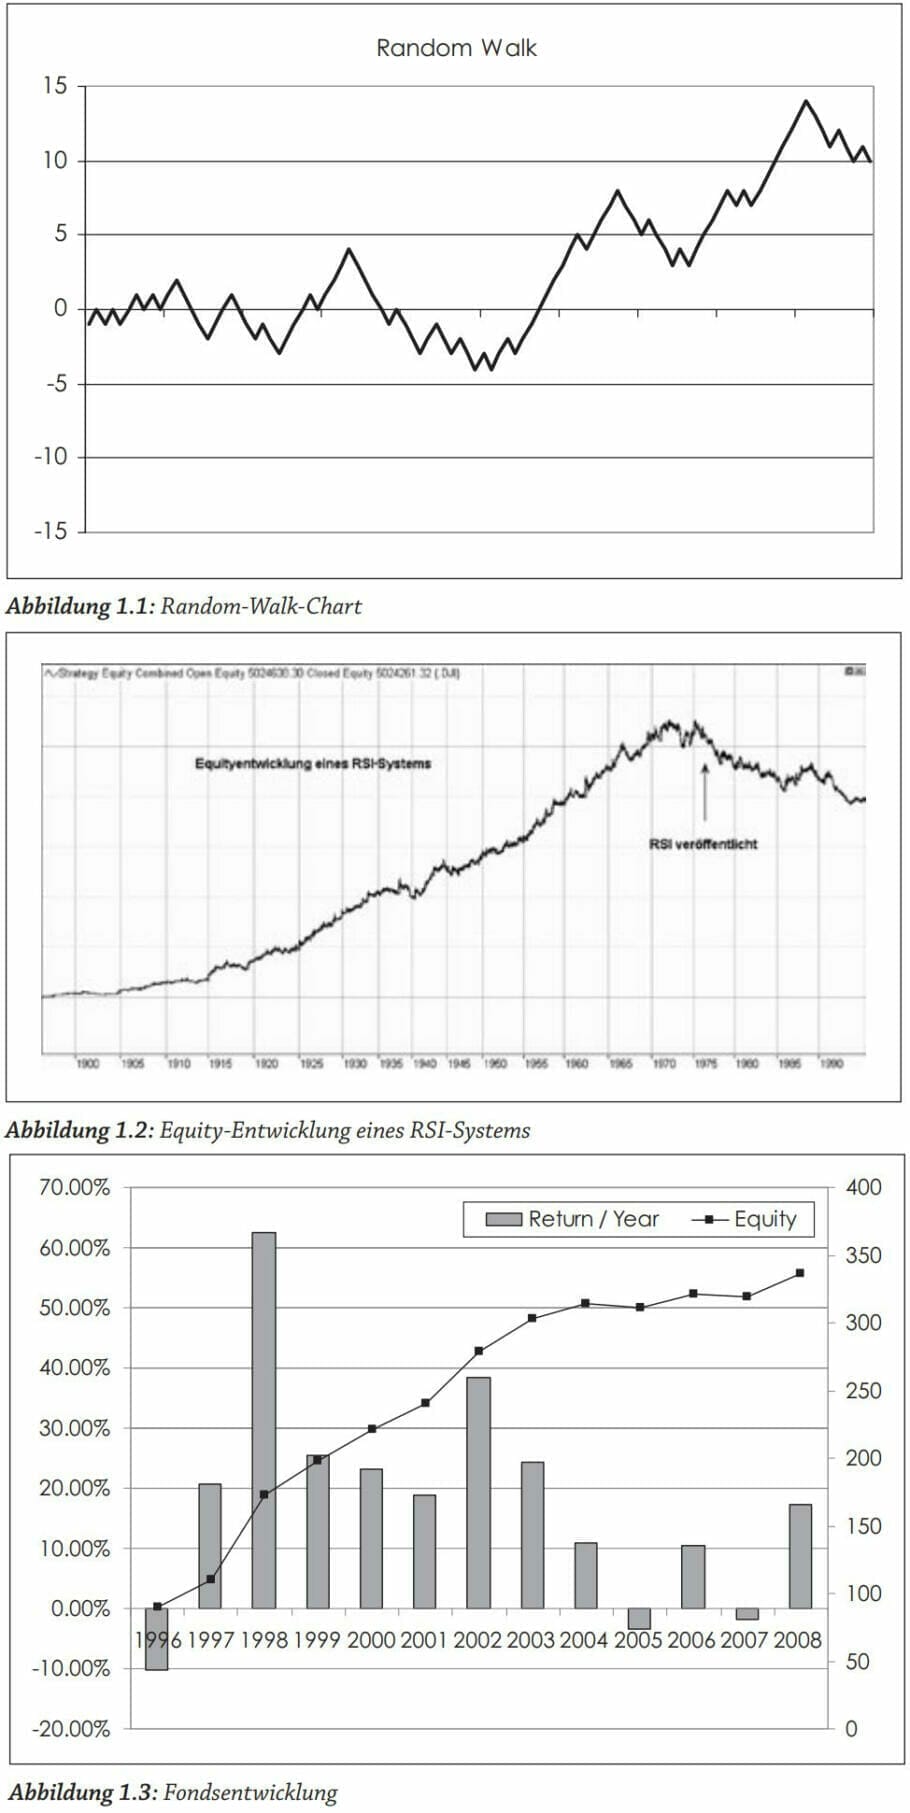
A vivid example of this market efficiency is a trading system based on the RSI indicator. The indicator was introduced by Welles Wilder in his book New Concepts in Technical Trading Systems in 1978 and, along with the simple moving average, is one of the best-known and most widely used indicators. Unfortunately, however, it seems that this indicator has caught up with efficient markets theory. If you look at the performance of a classic RSI system, ie "buy if the cut is above the 30 line, go short if the cut is below the 70 line," then you can quickly see that the best days of this system are clearly over. Until the release of the RSI, it seemed like you had made good money with such a trading approach, but since the indicator's release it doesn't seem that easy anymore. One reason for this can be market efficiency
How is the information transferred from an indicator to changed market behavior? At first glance this does not seem plausible, and yet the process of such a market adjustment is relatively simple. If all traders know that they should buy when the RSI breaks above the 30 line, then the price will rise for a short time due to the increased number of buy orders at that point in time. Instead of receiving the lower price that would come about without this effect, all market participants now buy at a price that is a few ticks higher. The same effect occurs when the indicator gives the counter signal and positions are closed or rotated. At this point, too, you get a worse price than would have been the case without the other RSI traders. At some point, the situation will be reached where the use of the indicator in this way of interpreting will no longer help. The information has been incorporated into the course, and the markets have once again proven their efficiency. Of course, this does not end the game. If the indicator no longer works because the price includes the information "buy at an average above the 30 zone", then many market participants will switch to another indicator
As a result, however, the price jump at the next RSI signal is not quite as large, and trading the signals may soon be worthwhile again. Then, however, the other dealers will probably create the efficiency again. The theory of efficient markets is also the sword of Damocles of trading systems. Once a System traded by too many people, it almost certainly loses its performance. This can also happen when trading a system with too large a volume. If you want to buy enough contracts at each signal that you yourself push the market up a few points, you are the trader creating market efficiency. This Behavior can also be observed in successful hedge funds.
The problem of large funds
Typically, this Problem is often the case with a large, systematically traded fund. The trading system had been functioning on a "smaller" scale for a number of years before the fund went public in 2003 and began collecting money. With the excellent performance of the underlying system, this was possible relatively quickly. But see for yourself what happened: the fund had scarcely been equipped with significantly more money than in previous years when the problem arose of accommodating this high volume on the market. And so this trading system started to affect the market with its large orders. Accordingly, the performance collapsed. Since 2003 you would have earned significantly less than you could actually expect in 2003.
If many people withdraw their capital again, the performance will probably pick up again. The trading system can trade with the market again instead of making the next course itself. The theory of efficient markets is also the basis for the random walk. If all available information is already reflected in the current course, then one cannot make any statement about the next course. In this case, one could also flip a coin to find out if long or short would be the better position. But that brings us back to the random walk. There, too, each next point is completely independent of the previous one. No past information can give me anything about that Future testify.
So if the theory of efficient markets were always correct, then you could save yourself from trading. There would be no viable way to gain an advantage over the other market participants and outperform the market average. This brings us back to buy-and-hold trading after all attempts to make money from trading.Strategies landed.
Here writes for you
Philipp Kahler is a finance and stock market expert and writes regularly in Traders' Magazine about trading with automated systems. He also organizes seminars for beginners and professionals on this topic. Another focus is the constant further development and optimization of trading software, which Kahler had already successfully used in proprietary trading at Bankgesellschaft Berlin All texts by Philip Kahler.
Popular Posts
-
Job profile! in change: from publisher to farmer thanks to a bank crash

-
Mediation & Leadership: Correctly solving conflicts for bosses

-
Dual Studies - Study with Vocational Training: Who Worth the Double Expenditure?

-
The 5 best books on automating the world of work: Solving digital problems {reading tip}

-
Admission and application tests: Overcome fear with templates and preparation

-
Visual communication & storytelling: 7 tips for better visual language

-
eMail Inbox 0: Steps to empty your inbox

-
How to guide in Startups: 4 Tips for Young Entrepreneurs


Post a Comment